In one of my previous post, I wrote about how I managed to integrate Docker and LabVIEW into my Continuous Integration chain.
Some of the readers asked about a little feature in Gitlab that I explored, Code Quality. Let’s discuss about it.
Code Quality Reports
Some weeks ago, digging into the Gitlab help pages (btw, I think I am spending a lot of time there), I found out that we could generate custom code quality reports. Usually, those reports are generate by a tool called “Code Climate”.
This engine runs a static analysis on some programming language source codes, and Gitlab provides docker images and the whole apparatus to perform these tests. But for LabVIEW, it does not work.
But, in other hand, this feature allows you to generate your custom reports from your analysis tool.
Usually these tools are very oriented to text language, so obviously won’t work with LabVIEW. We are constantly paying this graphical tax, as discussed by James McNally in his blog. Of course, that many things in LabVIEW compensate this tax, and every day that goes by, this gap between LabVIEW and other languages is decreasing.
VI Analyzer Static Code Analysis
For static code analysis, we have the incredible VI Analyzer, a highly customizable tool to check style, performance, and many other interesting items for standardizing the code in your organization.
The tool although generates some types of reports (txt, rsl and html) but none are compatible with the format from Gitlab.
The Gitlab format, as specified in this Help Page, it is a JSON file with the following fields.
[
  {
    "description": "'unused' is assigned a value but never used.",
    "fingerprint": "7815696ecbf1c96e6894b779456d330e",
    "location": {
      "path": "lib/index.js",
      "lines": {
        "begin": 42
      }
    }
  }
]
So, just convert the output of VI Analyzer Task to this format, right?
Yeah, kinda, this conversion has some very boring points, but to make it easy I am sharing my code to generate this report.
The usage is very simple, you will need the Project Path, Report Path and the results from VI Analyzer. Everything else, you can still use your previous CI Setup.
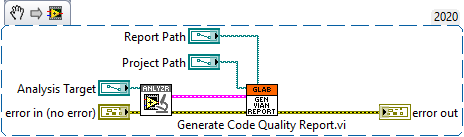
This VI is in a Gitlab Project, soon, I will be uploading other useful Gitlab Tools, so it will grow up.
https://gitlab.com/felipe_public/gitlab-tools-labview
What about the “begin” field
This field is a must-have in this report, it shows the line where the code failed. For LabVIEW users, it just doesn’t make any sense, so I ignored it, and in my reports as it is “0”, there is no line reported in the Gitlab User Interface.
The result will be something like this picture.
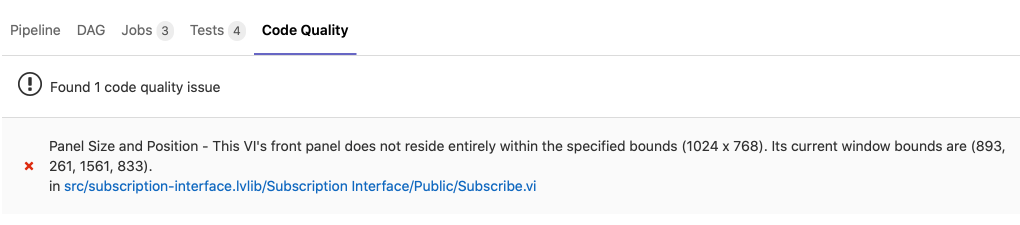
The Report is only generated if there are some failures, otherwise it is pointless.
Gitlab Setup
That is the easy part, you must just include these lines in the artifacts section of the VI Analyzer gitlab-ci.yml job.
artifacts:
    reports:
      codequality:
        - Your VI Analyzer JSON Report Path.
Next Steps
If you are angry of failing in some tests in VI Analyzer, there is a discussion here, probably it is a windows’ font issue. Or, you may want to customize to fail only if some high ranking tests fail, or you can set a maximum number of failures. There are rooms for lots of customization, depending on your usage.

Hi Felipe,
Thanks for sharing this. Just two small notes,
1 – Your GitLab project seems to be private (error 404 when you click on the link)
2 – Can you provide the code in a less recent LV version? This will help people try it quickly.
Thank you again for this blog post.
Olivier
LikeLike
Thanks for the feedback and for sharing. My bad, set already to public, also updated with a 2015 Sp1 version in releases. https://gitlab.com/felipe_public/gitlab-tools-labview/-/releases/.
LikeLiked by 1 person
Thanks!
LikeLike